One of the most popular tools to track the progress of a sprint is the burndown chart. It is an efficient way to visualize the status of the Sprint.
Working Mechanism of the Burndown Chart
Once the project team agrees on the product backlog fitting the next sprint, the development team uses its preferred technique to estimate the effort needed. Usually, it means the team breaks down the product backlog items into tasks. These tasks are small and specific enough to estimate them in hours. The result is the sprint backlog, containing the estimated tasks. The sum of all estimations is the “remaining effort” the team has to make for delivering the increment.
As the team progresses with the implementation, team members update the estimated remaining effort of every task. For instance,
- if a task has not been touched on a given day, its value would remain unchanged;
- if it has been delivered, the remaining effort would become 0;
- if some progress has been made, the team member can re-estimate the remaining effort.
The burndown chart shows the estimated remaining effort for each day.

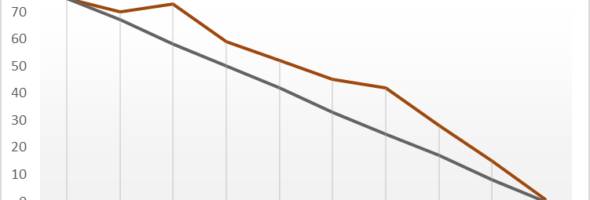
The sample chart visualizes a 2-weeks/10-days sprint.
On the first day, sprint planning resulted in an estimated effort of 75 hours.
On the 3rd day, the team identified new tasks. As a consequence, the burndown took an unusual upward turn.
During the remaining days of the sprint, the team managed to catch up and almost completed all tasks.
The “ideal burndown” represents the constant gradual progress which leads to the completion of all tasks. It serves as a visual aid: when the remaining effort is above the line the team is behind the schedule, when below the line, it progresses well.
The burndown chart can be enriched with further details, such as the number of remaining tasks or product backlog items, the number of delivered tasks per day, etc.
Some teams prefer to maintain the burndown chart manually, as part of their daily ceremony. However, most agile collaboration tools automatically calculate and visualize the burndown chart based on the up to date sprint backlog data.